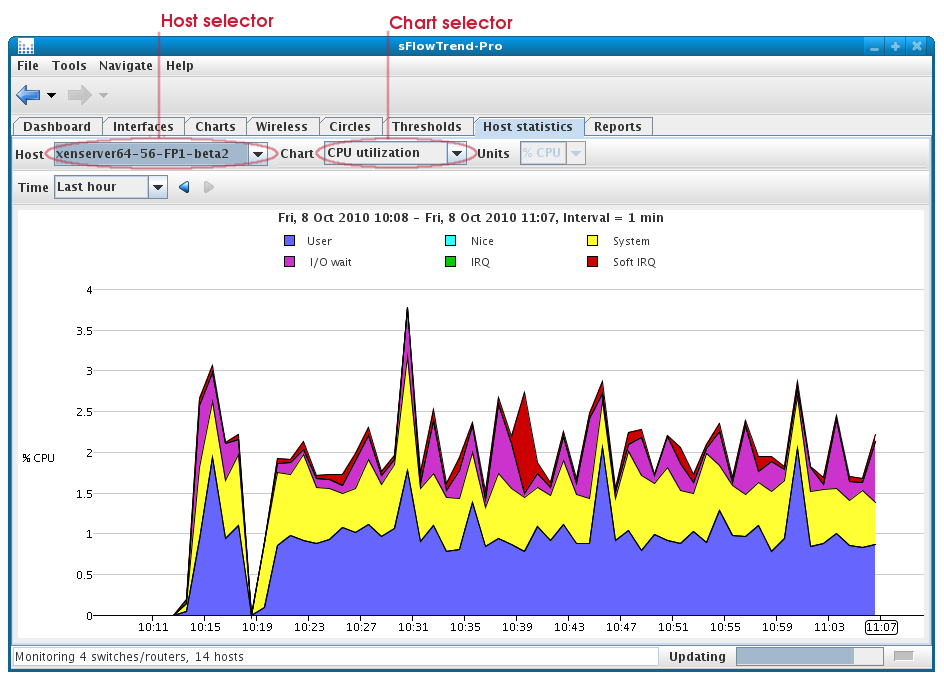
To view a trend in performance for a host, use the Host selector to select the host of interest. You can then use the Chart selector to select the performance metrics to trend.
If you select a physical host, the following charts are available:
- CPU Utilization
- The CPU utilization for each of the following categories: user, nice, system, IO wait, IRQ, Soft IRQ.
- CPU load
- 1 minute, 5 minute, and 15 minute load averages.
- Processes
- Number of CPUs and number of processes running.
- Interrupts
- Number of interrupts/s and number of context switches/s.
- Memory usage
- Memory usage for each of the following categories: used, shared, buffers, cache, free.
- Memory paging
- Pages/s in and out.
- Memory swapping
- Pages/s swapped in and out.
- Disk IO
- Bytes/s read and written.
- Disk usage
- Disk space used and free.
- Network bytes
- Bytes/s received and sent over the network interfaces.
- Network packets
- Packet/s received and sent for each of the following categories: packets, drops, errors.
If you select a virtual machine, the following charts are available:
- vCPU utilization
- % time that the CPU is busy.
- vMemory usage
- Memory used and free.
- vDisk IO
- Bytes/s read and written.
- vDisk usage
- Disk space allocated and available.
- Network bytes
- Bytes/s received and sent over the network interfaces.
- Network packets
- Packet/s received and sent for each of the following categories: packets, drops, errors.
You can use the Time selector to select
the period of time for which would like to view data. See
Section 3.3, “Changing the time selection  ” for information on using the
Timeselector and using the mouse to
drilldown on a time period of interest.
” for information on using the
Timeselector and using the mouse to
drilldown on a time period of interest.