Table of Contents
The Circles tab allows you to visualise the traffic flows between groups of addresses. For example, grouping end host addresses for each department allows you to view traffic between departments. Understanding network traffic in this way allows you to make accurate capacity planning decisions (eg, do I need to upgrade the link between the finance and the HR department?) and help enforce usage policies (are unauthorised hosts accessing the admin servers?).
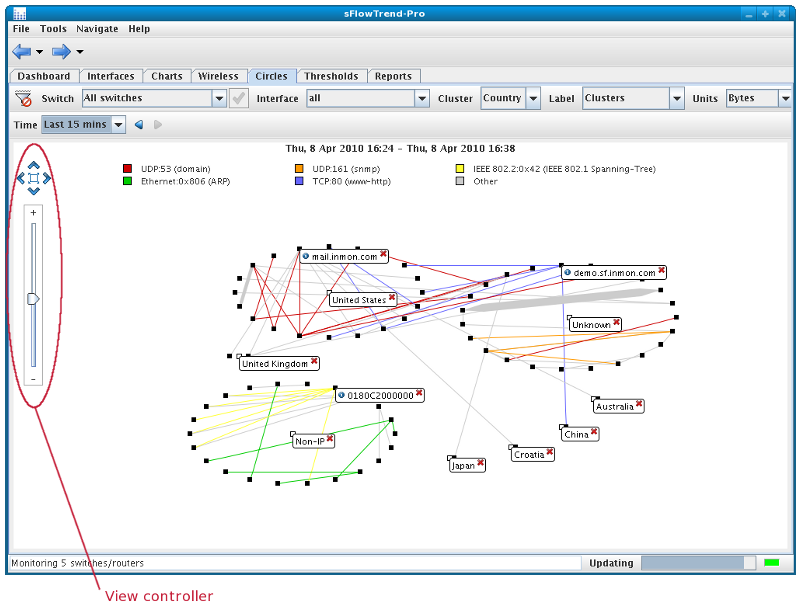
A Circles chart shows the top 100 traffic flows, with the end hosts which are responsible for the top 100 flows displayed as black squares, and clustered together in circles. Lines, coloured according to the traffic type, join the end hosts, of a flow. The width of a line is scaled according to the volume of traffic in the flow. The traffic type (or protocol) for each colour is shown in the chart legend. The legend entries are ordered left to right, ordered by the volume of each traffic type.
This tab includes a control bar that allows you to select the switch and interface for which you would like to analyse and view traffic data, whether the top flows should be determined by frames or bytes, and whether the clusters and flows should be labelled automatically.
To view data on network traffic flowing through a specific
switch, use the
Switch
selector in the control bar to select the switch that you
are interested in. The
Switch
selector lists the switches that have been included in the
sFlowTrend-Pro configuration, or that sFlowTrend-Pro is receiving
sFlow data from (see
Section 13.2, “Configuring agents in sFlowTrend-Pro  ”
for details on configuring switches in sFlowTrend-Pro). A switch
is listed using its SNMP IP address, sFlow agent address,
DNS Name or sysName (see
Section 13.4.1, “Setting the switch, interface, and host naming policy”).
”
for details on configuring switches in sFlowTrend-Pro). A switch
is listed using its SNMP IP address, sFlow agent address,
DNS Name or sysName (see
Section 13.4.1, “Setting the switch, interface, and host naming policy”).
The Switch selector in sFlowTrend-Pro also includes an option All switches.
When you select All switches, the resulting
chart displays the overall traffic through the network, such that,
if traffic crosses multiple switches, the traffic is counted
only once. If you would like to restrict the analysis to specific
switches, you can do so by using a filter, for example:
agent == "10.0.0.250" || agent = "10.0.0.248", where 10.0.0.250
and 10.0.0.248 are the sFlow agent addresses of the switches that
you are interested in (see
Section 3.2.2.4, “Filtering for specific traffic”
for more information of filtering).
also includes an option All switches.
When you select All switches, the resulting
chart displays the overall traffic through the network, such that,
if traffic crosses multiple switches, the traffic is counted
only once. If you would like to restrict the analysis to specific
switches, you can do so by using a filter, for example:
agent == "10.0.0.250" || agent = "10.0.0.248", where 10.0.0.250
and 10.0.0.248 are the sFlow agent addresses of the switches that
you are interested in (see
Section 3.2.2.4, “Filtering for specific traffic”
for more information of filtering).
Switches shown in italics in the selection list are disabled, meaning that data is not being stored for these switches.
To view data on network traffic flowing through a specific interface, use the Interface selector in the control bar to select the interface that you are interested in. The Interface selector lists the interfaces for the currently selected switch, for which sFlow data is being received and stored. An interface is listed using its ifIndex, ifName, or ifAlias (see Section 13.4.1, “Setting the switch, interface, and host naming policy”). Changing the interface selection causes a chart for the newly selected interface to be displayed.
The Interface selector also contains an option All. Selecting this option allows you to view traffic flows through the whole switch (across all interfaces).