Table of Contents
The dashboard is the screen displayed when sFlowTrend-Pro is first launched. The purpose of the dashboard is to give a summary of the overall status of the network, to help you identify problems quickly. The dashboard contains three main types of information:
The overall status of sFlowTrend-Pro.
The status of the top-level thresholds.
Charts showing the interfaces in the network reporting the largest values of utilization, frames, and errors and discards.
The status section of the dashboard shows a summary of the overall system, which can be useful for basic troubleshooting.
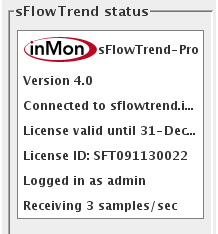
Some of the information shown:
To the right of the InMon Corp. logo is the product name. This should be sFlowTrend-Pro if you are running sFlowTrend-Pro, or sFlowTrend if running basic sFlowTrend. Also, if you are running sFlowTrend-Pro, information about the current license is shown, including the expiry date, and the license ID number. If you have multiple copies of sFlowTrend-Pro, the license ID is useful if you need to refer to the license you are running when you are using the InMon customer portal (//www.myinmon.com).
 If you are running the service version
of sFlowTrend-Pro,
then the server that you are currently connected to
is shown. If the display area of any of the status
items is not big enough to show the full text, then
you can hover the mouse over the text to read it.
If you are running the service version
of sFlowTrend-Pro,
then the server that you are currently connected to
is shown. If the display area of any of the status
items is not big enough to show the full text, then
you can hover the mouse over the text to read it.
If you have defined users to control access to sFlowTrend-Pro, the username of the currently logged in user is shown.
The current rate of incoming samples is shown. This number includes only samples that actually reached sFlowTrend-Pro, and are coming from enabled switches and hosts. If you are seeing no data in sFlowTrend-Pro, this number can help you determine why (see Section 14.1, “Troubleshooting sFlowTrend-Pro”).