Table of Contents
sFlowTrend-Pro is a Java application, which monitors sFlow® enabled network switches, routers and hosts. It is designed to be easy to install and use, and to allow network and host problems to be understood and resolved quickly. Summaries and detail of network traffic can be displayed, on a per-switch or per-interface level, thresholds used to provide alerts to abnormal traffic conditions, and historical traffic patterns reviewed to determine when changes occurred. Host performance metrics can be monitored for an entire datacentre.
As its name implies, sFlowTrend-Pro only monitors sFlow enabled switches, routers and hosts. For the sake of clarity, in the remainder of this documentation network devices will be referred to as switches; if there is an instance where a router has different behaviour or requirements, this will be highlighted.
sFlowTrend is a limited functionality version of
sFlowTrend-Pro. Throughout this documentation, sFlowTrend-Pro will be
used to refer to sFlowTrend and sFlowTrend-Pro. Features that
only apply to sFlowTrend-Pro will be highlighted with  .
.
sFlowTrend-Pro can be deployed in two different ways, depending on the option that you chose when evaluating or purchasing it. The options are:
- Run sFlowTrend-Pro as an application
-
This is the original version of sFlowTrend-Pro that was available, and remains the only one for sFlowTrend. When running as an application, data is collected when the application is running, and stops when the application is closed (or the user who launched it logs off).
Throughout this documentation, features that only apply to the application are highlighted with
 .
.
- Run sFlowTrend-Pro as a service
-
When running sFlowTrend-Pro as a service, the system is split into a client half and a server half. The server runs continually in the background, collecting data even when no-one is logged in. The client is used to run the GUI, and view the data from the server. The client can be run on the same system as the server, or a different one, and multiple clients can connect to the same server at once.
Throughout this documentation, features that only apply to the service are highlighted with
 .
.
When running sFlowTrend-Pro as an application, it is run from
Java Web Start. Java Web Start is a technology which allows Java
applications to be installed and run easily. The easiest way to
start sFlowTrend-Pro is to allow Java Web Start to create a desktop icon
and menu items for sFlowTrend-Pro when first installing it. After that,
just double click the desktop icon, or select the menu item as
appropriate, and sFlowTrend-Pro will launch. Note that data is only
collected while the application version of sFlowTrend-Pro is running.
The sFlowTrend-Pro service is installed via a
traditional installer. The installation starts the service.
After each reboot, the service is started automatically and data
collection will resume. The installation also includes two shortcuts:
- sFlowTrend-Pro local client
- This allows you to start a client which connects to the local service.
- sFlowTrend-Pro remote client
- This allows you to start a client that you can use to connect to a server running on a different, remote system.
sFlowTrend-Pro has an optional user authentication feature
(see Section 13.5, “Configuring user authentication  ”).
If enabled, only users who are authenticated with a
password can access the system and view data. Additionally, some
functionality, for example adding new switches to monitor, is only
available to administrators. If a particular part of sFlowTrend-Pro can
only be used by an administrator, this is highlighted with
in this documentation. Note that if user
authentication is not in use, then this does not apply and
everyone can access all of the features.
”).
If enabled, only users who are authenticated with a
password can access the system and view data. Additionally, some
functionality, for example adding new switches to monitor, is only
available to administrators. If a particular part of sFlowTrend-Pro can
only be used by an administrator, this is highlighted with
in this documentation. Note that if user
authentication is not in use, then this does not apply and
everyone can access all of the features.
sFlowTrend-Pro follows a familiar layout of many applications.
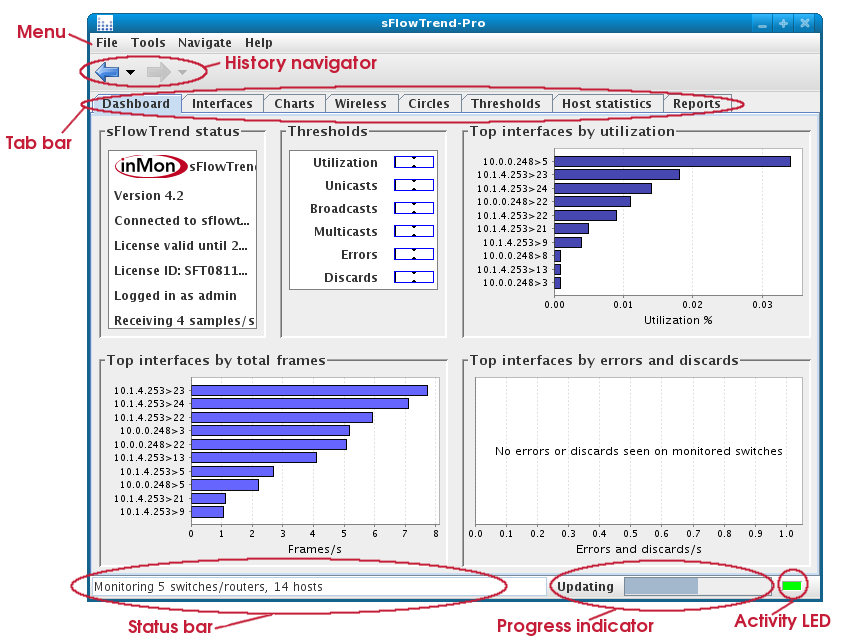
- Menu
- The main menu is available across the top of the window. A description of the menu items is given in Section 16.1, “Menu reference”.
- History navigator
- The history navigator allows you to move backwards and forwards through the recently viewed screens, in a similar way to a browser's history navigator.
- Tab bar
- Immediately below the menu bar are a number of tabs. Clicking on a tab will take you to the view associated with that tab. Some parts of sFlowTrend-Pro are equipped with hotlinks, which take you to a different view or tab when clicked (the mouse cursor will change to a hand when this is possible).
- Status bar
- Along the bottom edge of the window is a status bar, which shows the overall status of the switches and hosts being monitoring, or the status of the currently selected switch if the Charts, Wireless, or Interfaces tab is being viewed.
- Progress indicator
- The progress indicator is present when sFlowTrend-Pro is configured to monitor at least one switch. It indicates when the charts and tables will be updated with the most recent traffic data.
- Activity LED
- In the bottom right corner, a green activity 'LED' shows incoming sFlow samples. This flashes when each sample is received, and so provides a very quick way to see if the network is correctly configured to send sFlow.
