The Charts sub-tab allows you to
view a trend in performance for a host. Use the
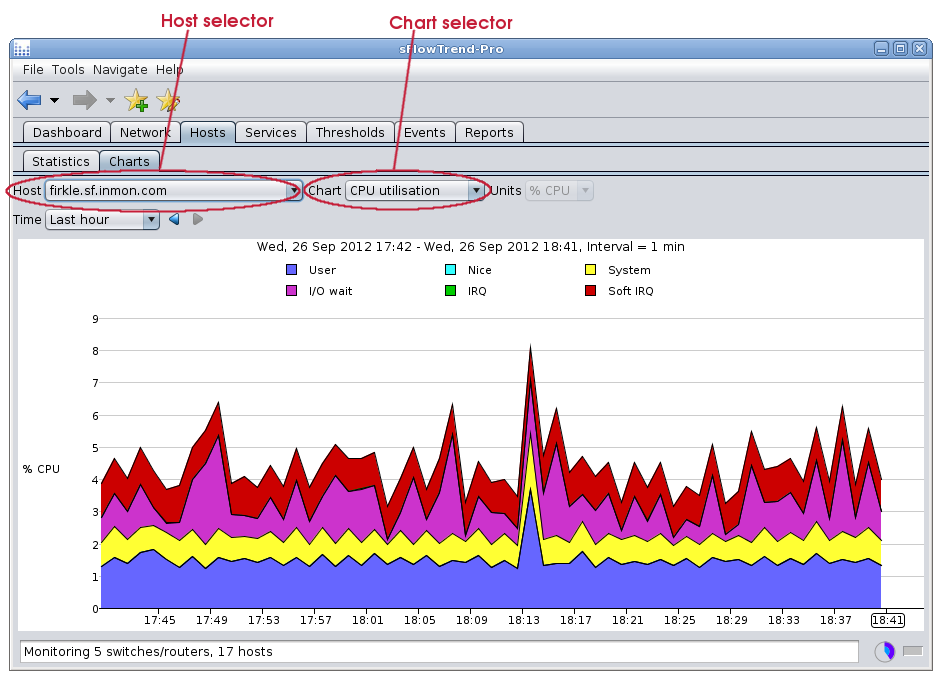
Host selector to select the host of interest
and the Chart selector to
select the performance metrics to trend. You can also
select specific time interval (Chapter 9, Selecting a time period  ) over which
to trend the data.
) over which
to trend the data.
If you select a physical host, the following charts are available:
- CPU Utilization
- The CPU utilization for each of the following categories: user, nice, system, IO wait, IRQ, Soft IRQ.
- CPU load
- 1 minute, 5 minute, and 15 minute load averages.
- Processes
- Number of CPUs and number of processes running.
- Interrupts
- Number of interrupts/s and number of context switches/s.
- Memory usage
- Memory usage for each of the following categories: used, shared, buffers, cache, free.
- Memory paging
- Pages/s in and out.
- Memory swapping
- Pages/s swapped in and out.
- Disk IO
- Bytes/s read and written.
- Disk usage
- Disk space used and free.
- Network bytes
- Bytes/s received and sent over the network interfaces.
- Network packets
- Packet/s received and sent for each of the following categories: packets, drops, errors.
If you select a virtual machine, the following charts are available:
- vCPU utilization
- % time that the CPU is busy.
- vMemory usage
- Memory used and free.
- vDisk IO
- Bytes/s read and written.
- vDisk usage
- Disk space allocated and available.
- Network bytes
- Bytes/s received and sent over the network interfaces.
- Network packets
- Packet/s received and sent for each of the following categories: packets, drops, errors.
Sometimes one performance counter value can be much smaller than the other performance counters, making it hard to see the the smaller counter value trend. In this case, you can view the trend for only the smaller counter, by clicking on the legend item corresponding to the counter of interest. For example, when viewing the CPU Utilization chart, clicking with the mouse button on I/O wait will change the chart to display only the trend for percent of CPU time spent waiting for IO; an additional trend line for the % of CPU time spent executing user processes can be added to the chart using Shift+ mouse button on User; or clicking with the mouse button on I/O wait or the background of the legend area will cause all trend lines to be displayed again.