Table of Contents
The Host sFlow standard, //www.sflow.org/developers/specifications.php, defines application performance metrics that a Host sFlow agent exports using the sFlow protocol. A number of popular applications now include sFlow monitoring. For example, sFlow agents are now available for popular web servers, providing scalable performance monitoring of large web server clusters and load balancers.
The Services tab presents application performance statistics for services that are being monitored using sFlow. This tab includes two sub-tabs:
- Counters
- Trend charts showing how the overall volume of application transactions varies over time. See Section 5.1, “Counters”.
- Top N
- Trend charts showing the top contributors to application transaction volume and how the top contributors vary over time. See Section 5.2, “Top N”.
The ability to directly relate server and application performance to the corresponding network traffic is a key element in unifying management of cloud environments.
The counters tab shows how the overall volume of application transactions varies over time. It uses stacked area charts to display the application performance counters.
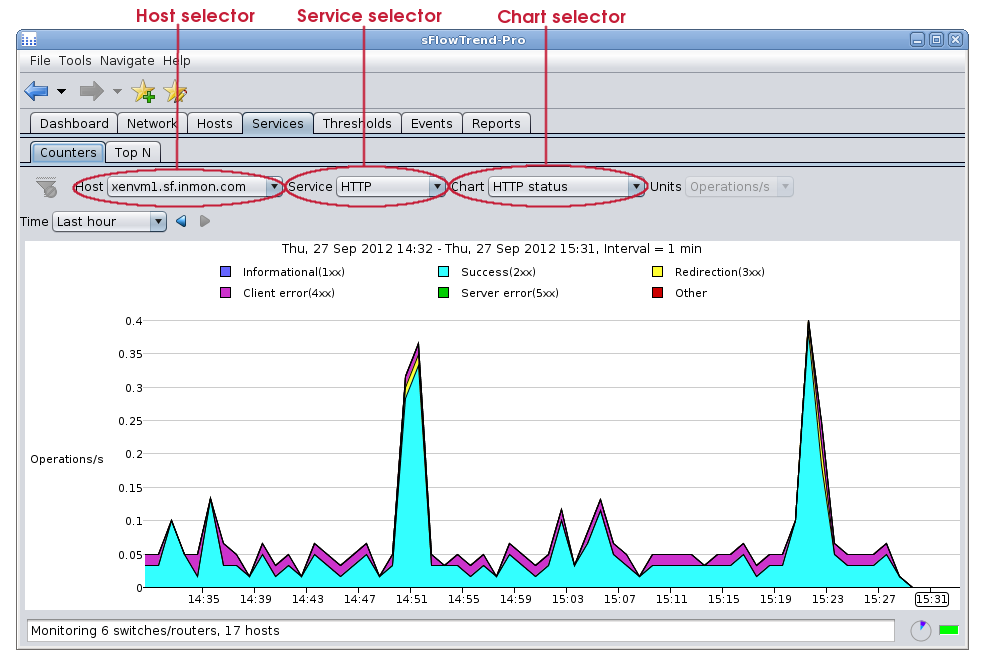
This tab includes a control bar which allows you to select
the host and service for
which you would like to view
trends in transaction volumes, the application performance
counters chart to display and
the specific time interval (see Chapter 9, Selecting a time period  ).
).
![[Note]](img/note.png) |
Note |
|---|---|
When you have made changes to the selections for the chart, you can save these selections in a bookmark (see Section 1.4, “Navigating around sFlowTrend-Pro using the history navigator”) so that you can easily return to the same chart at a later date. |
The following charts are available:
- HTTP method
- The trend in the number of operations per second for the various HTTP methods.
- HTTP status
- The trend in the number of operations per second with the various HTTP status codes.
Sometimes one performance counter value can be much smaller than the other performance counters, making it hard to see the the smaller counter value trend. In this case, you can view the trend for only the smaller counter, by clicking on the legend item corresponding to the counter of interest. For example, when viewing the HTTP status chart, clicking with the mouse button on Client error(4xx) will change the chart so that it displays only the trend for the number of operations per second that encountered client 400; an additional trend line for the number of successful operations/s can be added to the chart using Shift+ mouse button on Success(2xx); or clicking with the mouse button on Client error(4xx) or the background of the legend area will cause all trend lines to be displayed again.