sFlowTrend-Pro provides two types of charts:
- Interface counter charts
- These charts show how the overall network traffic load on an interface varies over time.
- Top N traffic charts
- These charts show the top N contributors to the network traffic and how the top N contributors change over time.
With sFlowTrend, or with sFlowTrend-Pro when the
Time
setting  is relative to now (for example
Last hour
see Section 3.3, “Changing the time selection ”),
these charts are automatically updated when the next data
point is available. The Progress indicator shows how long it
will be before the chart is next updated.
is relative to now (for example
Last hour
see Section 3.3, “Changing the time selection ”),
these charts are automatically updated when the next data
point is available. The Progress indicator shows how long it
will be before the chart is next updated.
Interface counter charts show how the overall network traffic load on an interface varies over time. These charts are generated from the interface counter data exported by sFlow. Interface counters charts are represented as stacked area charts. The following charts are available:
- Utilization
- This chart shows the utilization trend for the selected interface. The utilization chart is useful for identifying any capacity problems with the interface. If utilization approaches 100% for sustained periods then action should be taken to increase the capacity of the link, reorganise the topology of the network, or limit the applications making use of the link. Use the Top sources chart with Units selector set to Bits/s to start diagnosing the major sources of high utilization.
- Counters
- This chart shows basic interface counters. The counters chart is useful for examining the number of errors, broadcasts, multicasts or discards on an interface. High error rates can indicate a bad cable or interface card. High discard rates may indicate that the device cannot keep up with traffic. Use Top broadcasts or L2 multicast flows with Units selector set to Frames/s to help identify sources of high broadcast or multicast traffic.
An interface counter chart can only be displayed for a specific interface. If the Interface selector is set to All, the interface counter chart options are not shown in the Chart selector. You must change the interface selection to a specific interface before the interface counter charts options are available.
When the Utilization chart is chosen, the Units selector automatically changes to Bits/s, and cannot be altered. The chart left y-axis indicates bits/s while the right y-axis indicates % utilization of the link bandwidth.
When the Counters chart is chosen, the Units selector automatically changes to Frames/s and cannot be altered.
In the Counters chart, you can view the trend for only one interface counter statistic, by clicking on the legend item corresponding to the statistic of interest. For example clicking with the mouse button on Errors will cause a trend chart for errors only to be shown; an additional trend line for discards can be added to the chart using Shift- mouse button on Discards; or clicking with the mouse button on Errors or the background of the legend area will cause all trend lines to be displayed again.
Top N traffic charts show the top N contributors to the network traffic and how the top N contributors change over time. These charts are generated from the sampled packets exported by sFlow. Top N traffic charts are shown using stacked bar charts.
The following traffic flow charts are available:
- Top sources
- The top sources of traffic.
- Top destinations
- The top destinations of traffic.
- Top input VLANs
- The VLANs which are providing the most input traffic to the switch.
- Top output VLANs
- The VLANs which are receiving the most output traffic from the switch.
- Top source-destination pairs
- The top source address and destination address pairs.
- Top source-destination flows
- The top source address, source port, destination address and destination port flows.
- Top inter-VLAN pairs
- The VLANs between which most traffic is flowing.
- Top connections
- Top connections is similar to Top source-destination flows, but combines both directions of the traffic belonging to a client/server connection.
- Top servers
- The top servers.
- Top clients
- The top clients.
- Top protocols
- The top protocols.
- Top broadcast flows
- The top flows of layer 2 broadcast traffic.
- Top L2 multicast flows
- The top flows of layer 2 multicast traffic.
- Top IP multicast flows
- The top flows of IP multicast traffic.
- Most connected sources
- The top sources ordered by the number of destinations that each has connected to. This is also referred to as 'fan-out'. This chart is useful for security analysis, to help identify hosts that are exhibiting address scanning behaviour.
- Most connected destinations
- The top destinations ordered by the number of sources that has connected to each. This is also referred to as 'fan-in'. This chart is useful for security analysis, to help identify hosts that might be victims of a distributed denial-of-service attack.
- Most popular protocols
- The top protocols ordered by the number of source/destination address pairs. This chart is also useful for security analysis, and shows the protocols that are most likely being used to perform scanning.
![[Note]](img/note.png) |
Note |
|---|---|
In the VLAN charts, a VLAN of 0 indicates that no specific VLAN is being used, or the VLAN could not be determined. |
There are two types of Top N traffic charts:
- Rate-based charts
-
These charts show the top N contributors based on their associated traffic rate in either bits/s or frames/s. Example rate-based charts are Top sources, Top source VLANs, Top broadcast flows . Use the Units selector to choose whether the top contributors should be sorted based on their traffic rate in either bits/s or frames/s.
If a specific interface is selected, then the rate-based charts will show ingress traffic (above the x-axis) and egress traffic (below the x-axis). This shows the top N contributors of traffic entering or exiting the selected the interface. If the Units selector is set to Bits/s, the left y-axis will show the volume of traffic in bits/s, while the right y-axis will show the traffic volume in terms of % utilization of the interface bandwidth. If the Units selector is set to Frames/s, the traffic volume will be shown in frames/s.
If the Interface selector is set to All, the charts will show the top contributors over the whole switch. If a connection oriented, client/server chart (Top connections, Top servers, Top clients, Top Protocols) is chosen, the chart will show traffic flowing to the server above the x-axis, while traffic flowing from the server will be shown below the x-axis. For the other rate-based charts, selecting All interfaces results in one overall rate for the switch. You can use the Units selector options of Bits/s and Frames/s to show top contributors based on the their traffic rate in terms of bits/s or frames/s respectively.
- Count-based charts
- These charts (Most connected sources, Most connected destinations, Most popular protocols) show an absolute count value for each of the top contributors. For example, the Most connected sources chart shows the count of destinations for each of the sources that talk to the most destination hosts. When these charts are selected, the Units, selector automatically changes to Count and cannot be altered.
The legend in the Top N traffic chart shows the top
contributors for the selected interval. The outlined
time stamp, for example
 , on the x-axis indicates the currently
selected interval. You can select an interval and
see the top contributors in that interval by
clicking with the
mouse button on the bar corresponding to the
interval of interest. Each other bar in the chart
will then be recoloured to show how much traffic was
generated, in the interval represented by the bar,
by the top contributors from the currently selected
interval. This allows you to see how the top
contributors change over time.
, on the x-axis indicates the currently
selected interval. You can select an interval and
see the top contributors in that interval by
clicking with the
mouse button on the bar corresponding to the
interval of interest. Each other bar in the chart
will then be recoloured to show how much traffic was
generated, in the interval represented by the bar,
by the top contributors from the currently selected
interval. This allows you to see how the top
contributors change over time.
If the latest (right most) bar is selected and the
Time
setting is relative to now (for example
Last hour
see
Section 3.3, “Changing the time selection ”,
the charts will be updated automatically and
always display the contributors for the most recent
minute.
The grey part of each bar represents traffic not attributable to the top N shown in the legend (ie it represents the contribution from other sources, destinations etc. that are not in the top N).
If the whole of a bar is grey, the traffic in its interval is not attributable to any of the top contributors in the currently selected interval. You can click on this bar to make it the currently selected interval and see its top contributors.
You can use the legend in the Top N traffic charts to drill-down on traffic of interest. For example, if you are viewing a Top sources chart and you notice that one host is responsible for the majority of the traffic, you can investigate who this host is talking to and which application is generating the traffic by clicking with the mouse button on legend item that corresponds to the host. The Top source-destination flows chart will then be displayed with a filter for the selected host applied. This will show you the top source-destination flows for which the host of interest is the source.
See Section 3.2.2.3, “Filtering for specific traffic” for more information of filtering on specific traffic.
sFlowTrend-Pro allows the information displayed in a Top N traffic chart (but not an interface counters chart) to be filtered. This allows you to focus on traffic that may be of interest. For example, if you only wanted to look at web traffic, you could set a filter for only TCP port 80 traffic.
The filter is activated by clicking on the filter
button
 (if you are currently viewing an interface counters chart,
then the filter button is disabled). If the filter is
active, then the button is shown without a red line,
(if you are currently viewing an interface counters chart,
then the filter button is disabled). If the filter is
active, then the button is shown without a red line,
 ,
and the filter bar is displayed. If it is
inactive, the button is drawn with a red line
thought it, and the filter bar removed. The current
filter can be activated and deactivated by
repeatedly clicking the button. This does not remove
the text of the filter in place, so you can quickly
see the effect of filtering and not filtering your
data.
,
and the filter bar is displayed. If it is
inactive, the button is drawn with a red line
thought it, and the filter bar removed. The current
filter can be activated and deactivated by
repeatedly clicking the button. This does not remove
the text of the filter in place, so you can quickly
see the effect of filtering and not filtering your
data.
Filters are created by entering the filter into the filter bar. The filter can be specified just by typing the appropriate expressions into the filter bar, or to make it easier you can use the filter builder.
To bring up the filter builder, click the button at the right-hand end of the filter bar. The filter builder bar will appear below the filter bar.
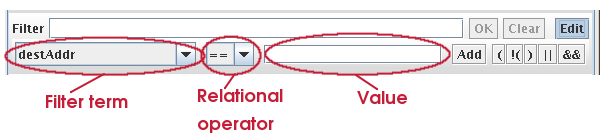
In the filter builder, you can select the term that you want to filter on, a relational operator (eg "==" for equality), and a value. For example, to filter on web traffic, you would select "serverTCPPort" for the term, the equality operator, and enter 80 for the value. Then, clicking on the button adds this expression to the filter.
You can combine many different expressions together,
using logical operators (|| for
or,
&& for
and).
For each expression you want to add to the
filter, click the
or
button as appropriate (you can also use parenthesis
to ensure the correct order of evaluation), then
select the expression you want and click
.
|
Note |
|---|---|
How you type the value to compare against
depends on what type of term you are
comparing. For entries such as TCP ports,
which are integers, just type the number.
For MAC or IP addresses, the value must be
surrounded by quotes: for example,
|
When the filter is complete, apply it by clicking the button at the right of the filter bar. The chart will be redrawn, using only data that matches the filter. The current filter is displayed at the top of the chart, to remind you how the data was filtered. If there was an error in the filter, then instead of the chart an error message will be displayed. Sometimes, it can be difficult to understand the error messages. Common errors are omitting quotes around an address, or using && or || without matching expressions.
When using the filter builder, you will notice that as the filter is constructed, it is entered into the filter bar. It is also possible to directly type into the filter bar. See Section 9.1, “Advanced use of filters” for more information on the format of filters. For a list of the available items to filter on, and their meanings, see Section 9.2, “Terms available for use in filters”.