Table of Contents
The Charts tab displays charts showing how network traffic varies over time.
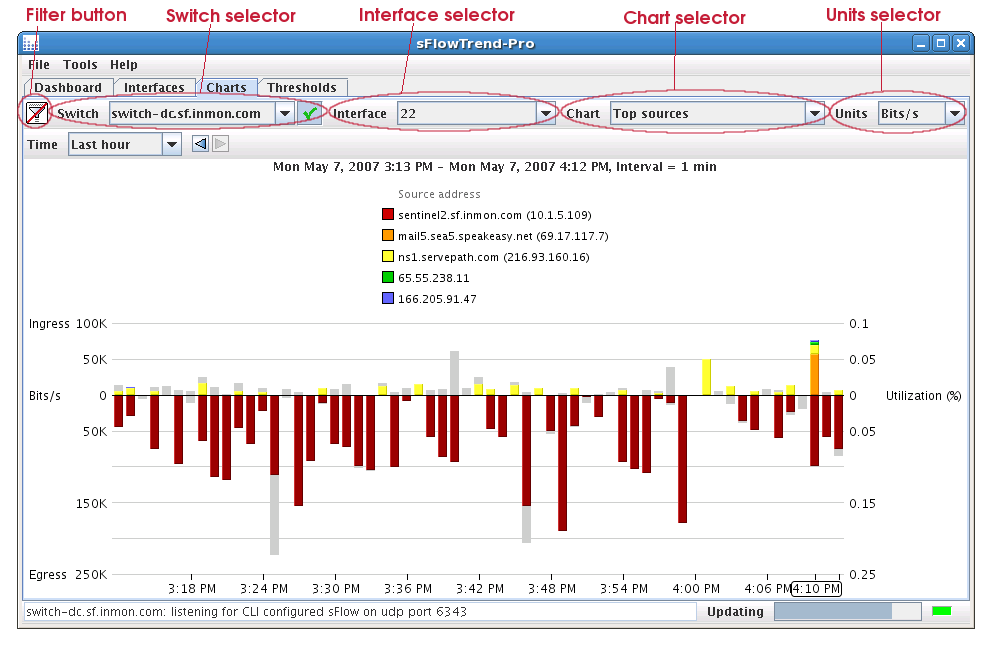
This tab includes a control bar that allows you to select the switch and interface for which you would like to analyse and view traffic data, and the type of chart to display.
To view data on network traffic flowing through a specific switch, use the Switch selector in the control bar to select the switch that you are interested in. The Switch selector lists the switches that have been included in the sFlowTrend-Pro configuration, or that sFlowTrend-Pro is receiving sFlow data from (see Section 7.1, “Configuring switches in sFlowTrend-Pro” for details on configuring switches in sFlowTrend-Pro). A switch is listed using its SNMP IP address, sFlow agent address, DNS Name or sysName (see Section 7.2.1, “Setting the switch and interface naming policy”).
Switches shown in italics in the selection list are
disabled, meaning that data is not being stored for these
switches. If the currently selected switch is enabled, click
the
 button to disable this switch. If the currently selected
switch is disabled, click the
button to disable this switch. If the currently selected
switch is disabled, click the
 button to enable this switch. Multiple switches can be
enabled in sFlowTrend-Pro
button to enable this switch. Multiple switches can be
enabled in sFlowTrend-Pro , whilst sFlowTrend allows
one switch to be enabled at a time. Changing the switch
selection causes a chart for the newly selected switch to be
displayed.
, whilst sFlowTrend allows
one switch to be enabled at a time. Changing the switch
selection causes a chart for the newly selected switch to be
displayed.
To view data on network traffic flowing through a specific interface, use the Interface selector in the control bar to select the interface that you are interested in. The Interface selector lists the interfaces for the currently selected switch, for which sFlow data is being received and stored. An interface is listed using its ifIndex, ifDescr, IfName, or ifAlias. (see Section 7.2.1, “Setting the switch and interface naming policy”). Changing the interface selection causes a chart for the newly selected interface to be displayed.
The Interface selector also contains an option All. Selecting this option allows you to view traffic flows through the whole switch (across all interfaces). This option is not available if the current chart selection is set to Counters or Utilization, since these charts can only display data for a single interface.