9.2. Editing report definitions and sections 
| ||
|---|---|---|
| Prev | Chapter 9. Reports | Next |
When you select a report definition or section in the reports browse pane, you can then edit its settings in the report settings pane.
The report settings pane also includes a number of controls:
 Allows you to save any changes to the settings.
This control is only active if you are an administrator and
you have changed the settings.
Allows you to save any changes to the settings.
This control is only active if you are an administrator and
you have changed the settings.
 Allows you to undo any changes to the settings since the last
save. This control is only active if you have changed
the settings.
Allows you to undo any changes to the settings since the last
save. This control is only active if you have changed
the settings.
 Allows you to run the report definition, including
all the sections with the current (possibly unsaved) settings.
The resulting report will be opened in a new window.
Optionally if you are an administrator, you can save the
results, by checking the Save results
checkbox before you run the report definition,
so that the results are available later and accessible to
other users.
Allows you to run the report definition, including
all the sections with the current (possibly unsaved) settings.
The resulting report will be opened in a new window.
Optionally if you are an administrator, you can save the
results, by checking the Save results
checkbox before you run the report definition,
so that the results are available later and accessible to
other users.
When you select a report definition in the reports browse pane, the reports settings pane will show the description for the report definition and also a table of saved report results.
You can edit the report description so that it describes the purpose of the report. This description is not shown in the report results.
Each row in the report results table shows the time at which the report results were generated and also the following columns:
 View the report results in a new window.
 View the report results in a browser.
 View the report results in PDF format.
 delete the report results.
To refresh the report results table to load report results that have been generated by other users click the
 under the report results table.
When you select a query section in the reports browse pane, the report settings pane will display the settings for the query section. In a query section you can define a query to specify the data that you want to extract from the database, and a display format for the data that is produced when the query is run.
A query specifies the data that you want to extract from the
database. When a query is run it produces a table of results.
When you define a query you are specifying the columns or
fields that should be present in the table.
A column can be a key field, for example
sourceAddress, or a
value field, for example
bytesTotal.
Each row in the table will represent a unique combination
of the keys and values associated with that combination. For
example, if a query is defined to have the fields
sourceAddress and
bytesTotal, then the query will produce a
table of data where each row in the table includes a unique
source address and the bytes sent by that address. sFlowTrend-Pro
supports both commonly used, basic queries defined using
Basic settings
(see Section 9.2.2.2, “Editing a query using basic settings”) and flexible,
complex queries using Advanced settings
(see Section 9.2.2.3, “Editing a query using advanced settings”).
When you add a new query section, a default query section will be created with Basic settings. You can edit these settings in the Basic settings tab, or if you are defining a more complex query, you can view the basic settings in the Advanced settings tab, and then edit the settings in this tab. However, if you edit the settings in the Advanced settings tab, the settings will become incompatible with the Basic settings, so you will only be able to view and edit the query settings in the Advanced settings tab.
The table of data produced when a query is run can be displayed in a number of different formats. You can select the most appropriate format for your use of the data. Displaying the data in a Table gives the raw data from the query; use this if you need the actual numbers. For example, you might want to check on the absolute utilisation of a link, or use the data in another application. Displaying the data in a Chart helps visualisation of the results; use this if you want to compare different items quickly, for example, easily see the largest contributors to the utilisation of a link. Another important difference between using a table and a chart is that a chart must have a value to plot. A table does not require a value, and so can be used to answer questions such as "which addresses were seen on a specific interface?".
In addition to choosing between a table and a chart, you can also decide whether to view the data as a total over the entire time period selected for the query, or as a trend of data over time. If you view the data as a total, then rows in the table represent data points for the whole time period. In this case, the interval from the time selector is ignored. If, however, you want to understand how a value changes over time, then you should select a trend. With a trend, each row in the table represents a data point for a period of time defined by the time selector interval.
If we use the Top Sources by frames query as an example, displaying the result of this query as a total will give the total frames sent by each of the top sources over the time period. Displaying the result as a trend will show how the number of frames sent by each of the top sources changed over time.
When a chart is used to display query results, the chart interprets results data using series, categories and values. sFlowTrend-Pro will choose the most appropriate fields to plot as categories and series based on the type of chart selected.
Categories are plotted on the x-axis of a
chart. Charts that show data as totals have
explicit categories, defined from the key fields that
were used in the query. The categories are
generated from all the unique combinations of the key
fields found in the data. For example, if the key
fields were sourceAddress and
destinationAddress, then
there will be a category for
source-destination pair found in the data.
Charts that show data as a trend over time use time as categories. Each category corresponds to an interval in the overall time period of the query.
Values are plotted on the y-axis of a chart. The value fields in the results form the values for the chart. Each category will a plotted against each of the values.
Each series contains a set of related data. How a series is plotted depends on the type of chart. For example, a bar chart will show each series as a set of bars of the same colour, and each category will have a bar of each colour. A stacked bar chart shows only one bar per category, but each bar will contain several segments, with each segment representing a series.
For charts that show data as totals, a series is
generated for each value field in the results. For
example, if the value fields were
framesTotal and
bytesTotal, then one series is
created for frames, and one for bytes. Recall that
for a totals chart the categories are created from
the key fields; this means that each series is
formed from the associated value field plotted
against each category.
For charts that show data as a trend, the series are
generated from the key fields in the results. This
is done in a similar way to the categories in a
totals chart: each series will consist of the unique
combinations of the key fields found in the results
data. For example, if the key fields consisted of
sourceAddress, then a series
would be created for each source address found in
the results. These series are then plotted against
time.
The display format information panel (see Section 9.2.2.2, “Editing a query using basic settings”) is useful in understanding how a query will be plotted. When a query is created in the basic or advanced settings tabs, then the categories, series and values that will be produced are shown. For time trend charts, since the categories are always time, this is assumed and not shown in the information panel. Similarly, for a totals chart, since the series are always generated from the values, the series are not shown. In the case of a table, the columns that will form the table are shown.
The following formats can be used to display the data:
Displays the data in a bar chart, with bars used to show the values for each series in the data. Bar charts are used to display and compare data summarised over the query time period.
If one series is available (in the query one value is selected), then a single bar per category is shown. If multiple series are present, then a group of bars is plotted for each category, with the bars coloured to indicate the series.
Displays the data in a stacked bar chart. This is similar to a normal bar chart, and when only one value field is selected in the query, produces the same result. However if multiple values are selected in the query, a series is generated for each value, and instead of plotting a separate bar for each series, a stacked bar is used. Each segment of the stacked bar represents a different series.
This type of chart is useful when two similar values
are to be compared, for example
framesIn and
framesOut for an interface.
Displays the data in a line chart trended over time. Each series in the data will be shown as a separate line in the chart, plotted against the categories. Use this chart to see how data changes over time.
A line in the chart is plotted for each series. With advanced charts, if more than one value is selected, a separate chart will be created for each value.
Displays the data in an area chart trended over time. Each series in the data will be shown as an area in the chart. The areas for each item will overlap, which can make the results of this chart difficult to see. You could try a line chart or stacked area chart if this is the case.
As with the line chart, each area in the chart is formed from the series, and a separate chart will be created if multiple values are specified.
The stacked area chart is identical to the area chart, except the areas are stacked on top of each other, rather than overlapping. This can make the chart much easier to read.
Use a table to view the raw results of your query. The table will include a column for each field specified in the query. It is not necessary for the query to include value fields, so a table is useful for inventory reports, where you want to understand what is present, rather than how much traffic is being generated.
All the columns for the query will be displayed in the table.
The trend table also displays data in a tabular form, but includes time as the first column. Use this type of table to get the specific values from a query, instead of the visualisation provided by charts.
All the columns for the query will be displayed. Each row in the table will include the time, and associated data for that time. If there are multiple data points per time period, then there will be multiple rows with the same time. Also, if there are any data points which are the 'other' from a top-n query, then they will be shown with the non-value columns blank (the columns for value fields will show the value for 'other').
The Basic settings tab helps you define and parameterise commonly used queries. These queries are very similar to those used in the Charts tab (see Section 3.2, “Chart types”) and Host statistics tab (see Section 8.2, “Trending host performance”).
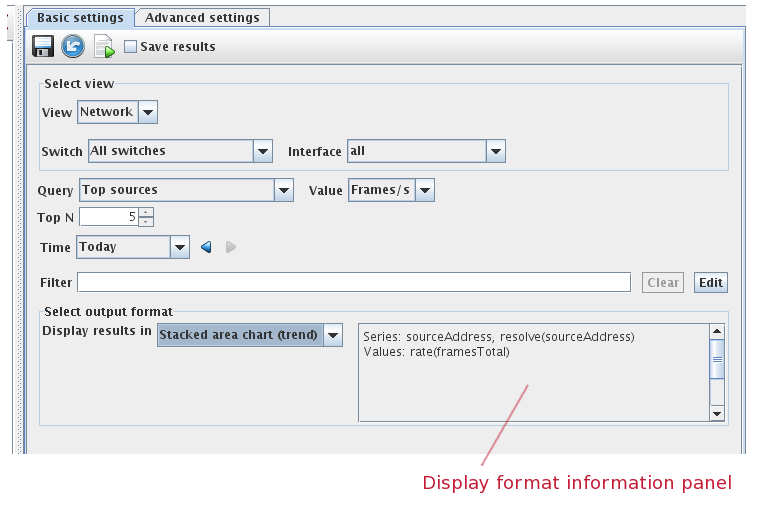
To define a query using Basic settings, first decide whether you are interested in network traffic data (use the View selector to select Network) or host performance data (use the View selector to select Host).
If the query is focused on network traffic data, you can select whether the query should extract data for the whole network or for an individual switch or interface. If the query should extract data for the whole network, use the Switch selector to select All switches. In this case, even if a traffic flow crossed multiple switches, the flow will only be counted once - ie the query de-duplicates the data. If the query should extract data about traffic crossing an individual switch and/or interface, use the Switch and Interface selectors to select the switch and interface of interest.
If the query is focused on host performance, you can select whether the query should extract data for all hosts or an individual host using the Host selector.
The next step is to use the Query selector to choose a predefined query; you can think of this as selecting the key fields for the columns in the query results. You can then use the Value selector to specify the value field column for the results. Note that the Utilization and Counters predefined queries are only available when a single interface is selected using the Switch view and Interface view selectors.
The next step is to parameterise the query:
 ”.
”.
Once you have fully parameterised the query, you can select how you would like the results to be displayed using the Display results in selector to select a display format. When you select a display format, sFlowTrend-Pro helps you understand how the data produced by the query will be displayed. For example, if you select Bar chart (totals), the display format information panel will show which fields will be used for the categories (bars) and the value field used to determine the height of the bar.
The Advanced settings tab allows you to define your own queries by manually selecting the key fields and value fields that the query should extract data for.
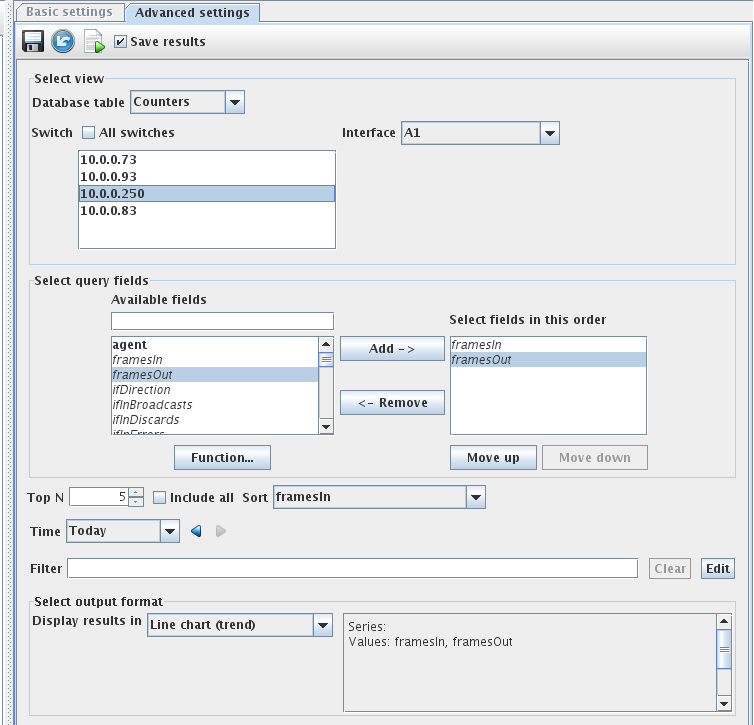
To define a query using Advanced settings, first select the database table that query should access. sFlowTrend-Pro includes three database tables:
If you have selected Counters or Flows database table, you can then decide whether the query should extract data for the whole network or for specific switches or a specific interface. If the query should extract data for the whole network, check the All switches check box. If the query is to extract data for specific switches, then make sure that the All switches check box is not checked, then select one or multiple switches from the list of switches being monitored. If the query should extract data about traffic crossing an individual interface, select the switch for the interface, then use the Interface selector to select the interface of interest. If the query is defined to have a view with multiple switches, if a traffic flow crossed multiple switches, the flow will only be counted once - ie the query de-duplicates the data.
If you have selected the Host counters database table, you can then decide whether the query should extract data for all hosts or for specific hosts. If the query should extract data for all hosts, check the All hosts check box. If the query is to extract data for specific hosts, then make sure that the All hosts check box is not checked, then select one or multiple hosts from the list of hosts being monitored.
The next step is to specify the fields for which the
query should extract data for. The
Select query fields panel allows you to
select fields from those available for the selected
database. The available fields are shown in the
Available fields list, with the
value fields listed in italic.
If you want to display the results of the query in a chart,
you must select at least one value field.
The Available fields list
includes a type in text field that allows you to filter
the available fields for fields whose names match the
typed in text. For example, if you have selected the
Flows database, you can type
addr into the type in field to see
only those fields which include
addr in their names.
You can also specify functions of fields. Functions are described at Section 16.4, “Database functions”. Click the Function button to show a dialog that helps you build a function. Some functions may not be relevant for the selected database.

If you have selected at least one value field, you will have the option of selecting whether the query results should be sorted and which value the results should be sorted on. You can also specify the Top N, which will cause the query results to show only the top n entries when sorting on the specified value. You can also choose to see all the results by checking the Include all checkbox, this is only sensible if you choose to display the query results in a table.
As with the Basic settings, you can parameterise the query further by selecting a time period for which data should be extracted and a filter to select traffic that meets certain attributes.
The final step is to select the output format for the query results using the Display results in selector.
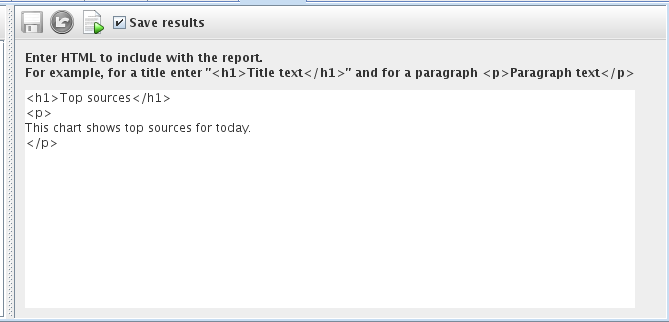
When you select an HTML section in the reports browse pane, the report settings pane will display the settings for the HTML section. An HTML section can be used to provide formatted and unformatted content in the report. For example, if you would like to show a title and a description for a chart produced by a query section, you can insert an HTML section before the query section. You can then edit the settings for the HTML section as follows:
                <h1>Top sources</h1>
                <p>This chart displays top sources for today</p>
You can enter text or HTML formatted text in an HTML section.